Authors:
Odessa G. Tolentino-Wilson, M.D., FPCP
Augusto D. Litonjua, M.D., FPCP, FPSEM, FACE
Section of Endocrinology and Metabolism
Makati Medical Center
INTRODUCTION:
Vildagliptin is a member of the dipeptidyl peptidase IV inhibitor (DPP-IV inhibitor) class of drugs. These drugs are believed to improve glucose variability by restoring the physiologic pattern of insulin secretion. Vildagliptin improves glycemia by improving beta and alpha cells’ sensitivity to glucose.1 This addresses the impaired glucose-mediated suppression of glucagon secretion in diabetes that results in increased hepatic glucose output and subsequently hyperglycemia.2
In a study that compared the effect of vildagliptin and glimepiride on prandial glucagon levels, vildagliptin did not have an increase in insulin secretion as much as what was seen in the glimepiride group but was shown to improve insulin resistance and lower prandial glucagon levels resulting to similar glucose levels but with less risk of hypoglycemia.1
Exposure to glycemic disorders can be described as a function of 2 components: the duration and magnitude of chronic sustained hyperglycemia and the acute fluctuations of glucose over a daily period.3
Recent studies suggest that glucose variability may play a significant role in the risk for diabetic complications. These studies show that glucose variability is more deleterious to endothelial function and oxidative stress than mean glucose or sustained chronic hyperglycemia4,5. In vitro studies have shown that intermittent high glucose enhances cell apoptosis and production of substances that activate oxidative stress.6
The significance of this study is to determine the effect of vildagliptin compared to glimepiride in improving glycemia by assessing its effect on acute glucose fluctuations which can contribute to the development of diabetic complications.
GENERAL OBJECTIVE:
The purpose of this study is to compare the effect of Vildagliptin (Galvus) and Glimepiride(Solosa) on glucose variability among Type 2 Diabetes patients not controlled on Metformin alone.
SECONDARY OBJECTIVES:
- To determine and compare the 24 hour glycemic profile of the 2 treatment arms using the mean glucose values obtained from the 7 point capillary blood glucose monitoring of the study subjects.
- To compare the effect of vildagliptin and glimepiride on the postprandial glucose excursions of patients between the two treatment arms.
- To compare the glucose variability between the two treatment arms using the mean amplitude of glycemic excursions (MAGE).
STUDY DESIGN: PROSPECTIVE, RANDOMIZED, OPEN-LABELED STUDY
METHODS:
The investigation was a prospective, interventional, randomized, open-labeled, active control, parallel assignment, efficacy study. The calculated sample size for the study was 42 patients, 21 patients for each study arm, but was cut down to 18 patients due to budget constraints. Subjects were recruited from the outpatient department and private clinics of Endocrine consultants at Makati Medical Center. Clinical data such as age, gender, height, weight, duration of diabetes, Hbaic levels, serum creatinine, SGPT, concurrent medications and other comorbidities were recorded.
Inclusion Criteria included all adult patients between 18-80 years of age diagnosed with type 2 Diabetes Mellitus for less than 10 years, with Hbaic level between 6.5%-10% (NGSP certified) and body mass index of 20-35, with inadequate glycemic control with metformin (at least 1000 mg) for at least one month. Patients on other oral hypoglycemic agents other than metformin, or on insulin were excluded from the study. Additional exclusion criteria were serum creatinine of more than or equal to 1.3mg/dl, SGPT of more than or equal to 90; those with severe diabetic complications (Cerebrovascular accidents, chronic kidney disease, myocardial infarction, peripheral vascular disease) or on medications affecting glucose profile (i.e. steroids), those with congestive heart failure (NYHA class 2 and above), infectious disease, malignancy or were pregnant or breastfeeding during the time of the study.
Female patients who were included were advised to use contraception and in case they got pregnant, they were pulled out from the study.
Qualified patients who agreed to participate were asked to sign a written consent form. (Appendix 2, 3, 4, 5). They were randomly allocated to either the dipeptidyl peptidase–IV (DPP-IV) inhibitor group or sulfonylurea group. The DPP-IV inhibitor group was given Vildagliptin (Galvus) 50mg 1 tablet twice a day for one month. The sulfonylurea group was given Glimepiride (Solosa) 1mg 1 tablet once a day for one month. The medications for the entire study period were given to the patients for free. Patients were also given a free glucometer and a set of test strips. They were asked to monitor their capillary blood glucose at seven points throughout the day: before morning, lunch and evening meals; 2 hours after the start of each meal; and at 3 AM twice a week for 5 weeks. In cases of hypoglycemia, patients were advised to directly call the primary investigator. Signs and symptoms of hypoglycemia including cold sweats, dizziness, hunger, tremors, body weakness, blurring of vision and confusion were discussed with the patient. Measures to address hypoglycemic episodes during the study period such as taking 2-4 teaspoons of sugar , eating candies or chocolates, drinking a glass of sweet juice or regular soda or eating a regular meal, rechecking the blood sugar after 1 hour and doing the steps repeatedly until the sugar normalizes were discussed to the patient during the enrollment period. In cases of hypoglycemia (capillary blood sugar less than or equal to 60 mg/dl), the patient on the Glimepiride (Solosa) arm were asked to withhold the medication until the next blood sugar value becomes more than 90mg/dl (Appendix 7a- Vildagliptin arm; 7b-Glimepiride arm).
DEFINITION OF TERMS:
- Type 2 Diabetes – Patients who fulfill any of the following criteria: Fasting plasma glucose of 126 mg/dl or above; 2 hour plasma glucose of 200 mg/dl or above during a standard 75 g OGTT; Random blood glucose of 200 mg/dl or above with signs and symptoms of hyperglycemia; Hba1C of 6.5% and above or those already on treatment.
- Mean Amplitude of Glycemic Excursions (MAGE) – parameter used to quantify glucose variability, obtained by measuring the arithmetic mean of the glucose increases or decreases (from blood glucose nadirs to peaks and vice versa) when both ascending and descending segments exceeded the value of one standard deviation of the blood glucose for the same 24 hour period. 7,8
- Hypoglycemia – capillary blood sugar below 60 mg/dl associated with signs and symptoms i.e. sweats, dizziness, hunger, tremors, body weakness, blurring of vision and confusion.
STATISTICAL ANALYSIS:
Qualitative clinical profile variables were presented using frequencies and percents while quantitative clinical and metabolic profile variables were presented using mean +/- standard deviation. For comparing qualitative clinical profile variables between the two study arms, chi-square test was used while quantitative clinical and metabolic profile variables were compared between the two groups using independent t-tests.
Glucose values, postprandial incremental area under the curve (AUCpp) and mean average glycemic excursion (MAGE) are presented as mean +/- standard error.
The MAGE was calculated using the glucose values obtained from the seven-point blood sugar monitoring of each patient. Increases of >1 SD of the mean glycemic values were taken into account. Calculation of the MAGE was then obtained by measuring the arithmetic mean of the differences between consecutive peaks and nadirs; measurement in the peak-to-nadir and nadir-to-peak direction was determined by the first qualifying excursion.7,8. On the other hand, the AUCpp was computed as follows: the 3 preprandial values (before breakfast, lunch, and dinner) were read on the time curves. Second, the incremental areas above preprandial glucose values were calculated from the postprandial blood glucose values. Third, the 3 incremental areas obtained on each study day were summed and averaged to calculate the mean postprandial incremental area under the curve (AUCpp) in each patient.3,9
In determining the treatment effect, time effect, and combined treatment and time effect on the MAGE, AUCpp and mean glucose values from the 7 point capillary blood glucose monitoring, between-within repeated measures analysis of variance was used.
The satisfaction of the normality assumption was checked using Kolmogorov-Smirnov test.
Level of significance for all statistical tests performed was set at 0.05.
All statistical computations were performed using SPSS for Windows version 16.
RESULT AND DISCUSSION:
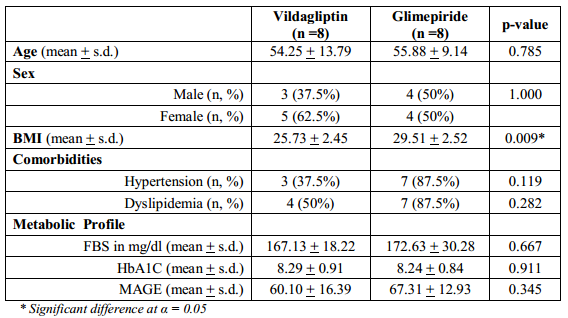
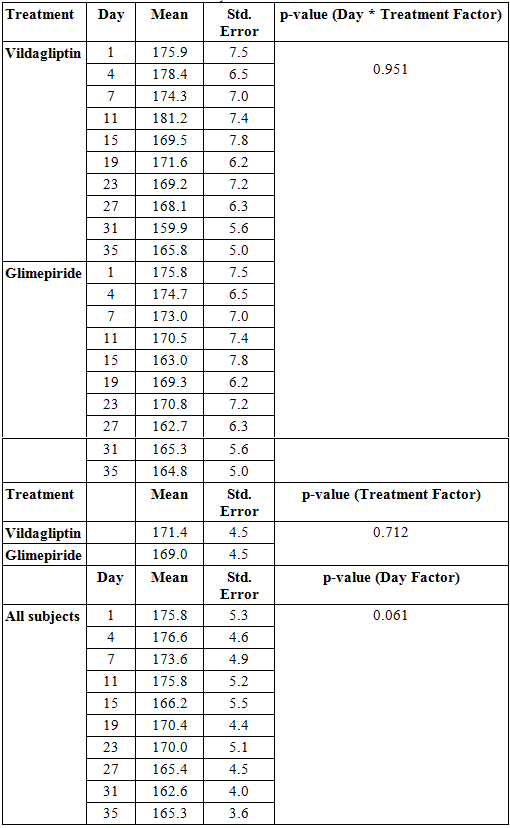
Table 1 shows the clinical and metabolic profile of the subjects in both Vildagliptin and Glimepiride arms. It can be inferred from the table that the two groups are comparable in terms of baseline clinical and metabolic variables except for BMI such that subjects in the Glimepiride group have higher mean BMI (p-value < 0.009).
Table 1. Clinical and Metabolic Profile of the Subjects
The mean glucose values using the 7-point capillary blood glucose monitoring of subjects from both treatment arms were plotted against time to generate a 5-week blood glucose profile (Figure1). Subjects in both the Vildagliptin arm and the Glimepiride arm showed a downward trend in the blood glucose values from day 1 to 35.
Figure 1. Mean Glucose Values per Day from 7-Point Capillary Blood Glucose Monitoring
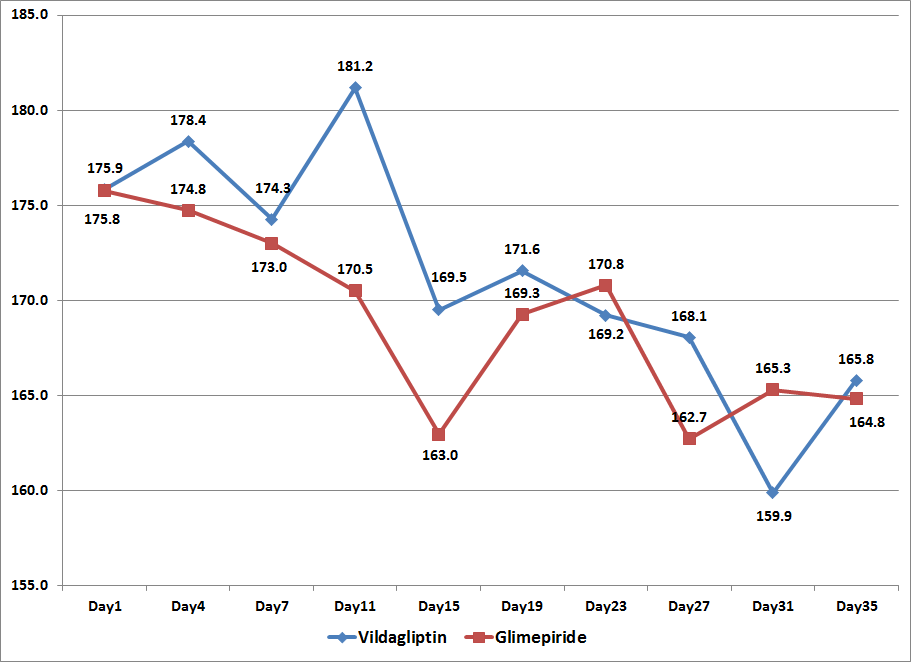
Looking at the comparison of the mean glucose values per treatment arm per day of observation starting at day 1 until day 35, data showed no significant difference between the two groups (p-value > 0.951, Table 2).
The overall mean glucose values of the subjects in the Vildagliptin and Glimepiride arms were also not found to be significantly different from each other suggesting that treatment effect was not significant between the two groups during the entire study period (p-value > 0.721, Table 2).
Differences in the blood glucose values between the two treatment arms across days of observation were likewise analyzed and showed no significant difference. (p-value > 0.061, Table 2)
Based on these findings, both vildagliptin and glimepiride resulted to improved blood glucose values of the subjects in both treatment arms and both treatments were found to be comparable in their blood sugar lowering effect. However, significance of their comparability of effect cannot be concluded from these data as statistical significance was not reached due to inadequate sample size.
Table 2. Mean Glucose Values across Treatment and Days
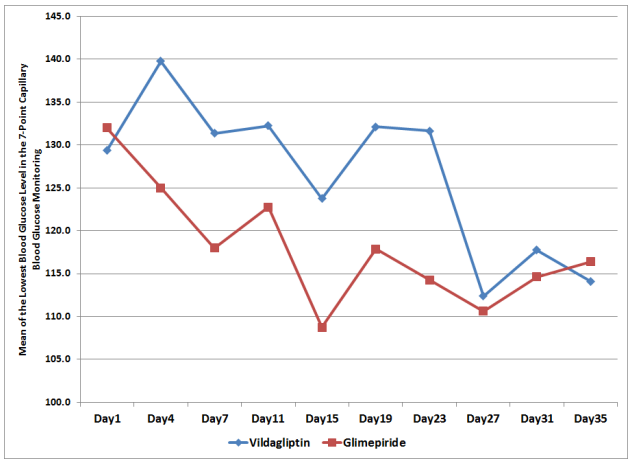
Comparability of effect was further analyzed when the highest and the lowest blood sugars were compared. Both vildagliptin and glimepiride arms had comparable blood sugars at the beginning of the study, 220.8 mg/dl ±7.9 and 226.6 mg/dl ± 7.9 respectively (p-value 0.385). However, it can be seen that glimepiride had a steeper decline in the blood sugar levels compared to vildagliptin but with comparable blood sugar levels at the end of the study, 114 mg/dl ± 8.3 and 116.4 mg/dl ± 8.3 respectively (p-value 0.820) (Figure 2, Table 3). This suggests that both may have comparable effects in blood sugar lowering but vildagliptin has lesser risk of hypoglycemia.
Table 3. Comparison of the mean highest and lowest blood sugars
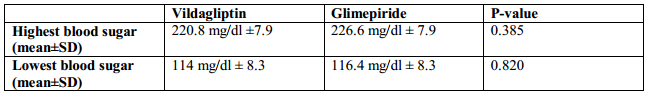
Figure 2. Means of the Lowest Blood Glucose Level in the 7-Point Capillary Blood Glucose Monitoring
To compare for the postprandial glucose excursions of patients in each treatment arm, the mean postprandial incremental area under the curve (AUCpp) was computed. The mean AUCpp of the patients from both treatment arms were plotted from Day 1 to Day 35 of the study period (Figure 3).
Figure 3. Mean Postprandial Incremental Areas Under the Curve (AUCpp) across Days
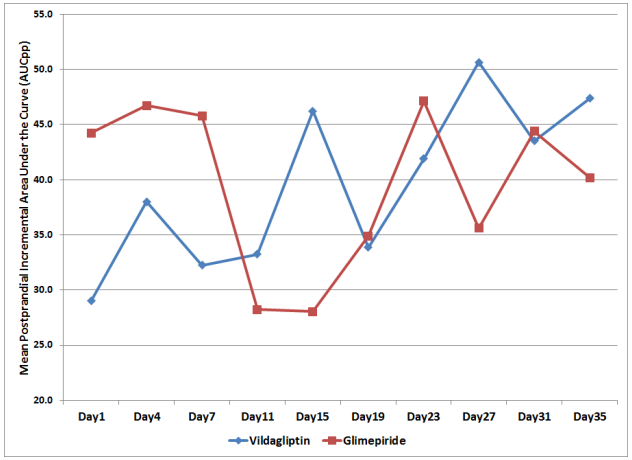
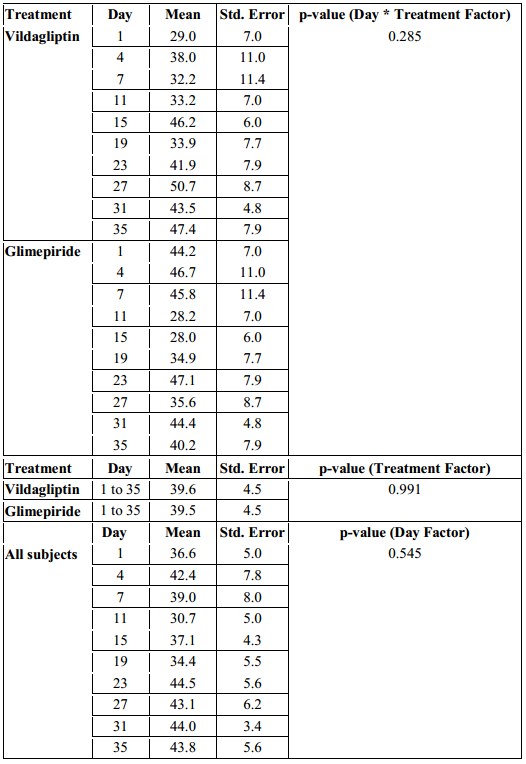
Combined effect of the day of treatment and treatment effect showed no significant difference between the two groups with regards to their AUCpp (p-value > 0.285, Table 4).
The overall AUCpp of subjects in the Vildagliptin and Glimepiride arms were also not found to be significantly different from each other. The mean of the AUCpp of patients in the Vildagliptin arm was 39.6 mg/dl compared to 39.5 mg/dl in the glimepiride arm. This suggests that both treatment had comparable effect on AUCpp, however was not found to be statistically significant (p-value > 0.991, Table 4).
Differences among mean AUCpp across days were likewise not found to be significant (p-value > 0.545, Table 4).
Table 4. Mean Postprandial Incremental Areas Under the Curve (AUCpp) across Treatments and Days
The mean amplitude of glycemic excursions (MAGE) of the patients from the two study groups were likewise computed and graphed from Day 1 to Day 35 (Figure 4).
Figure 4. Mean Amplitude of Glycemic Excursions (MAGE) across Days
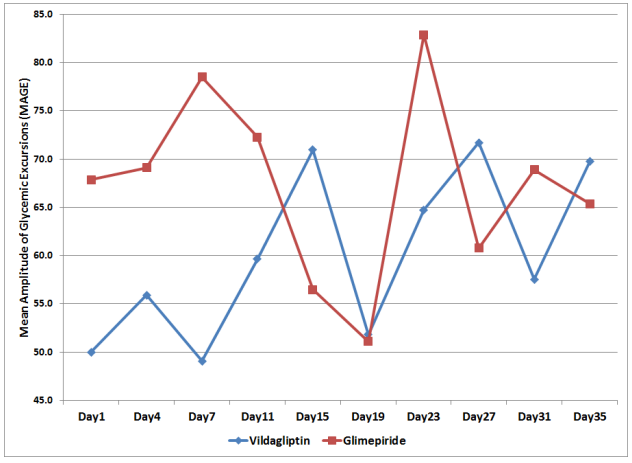
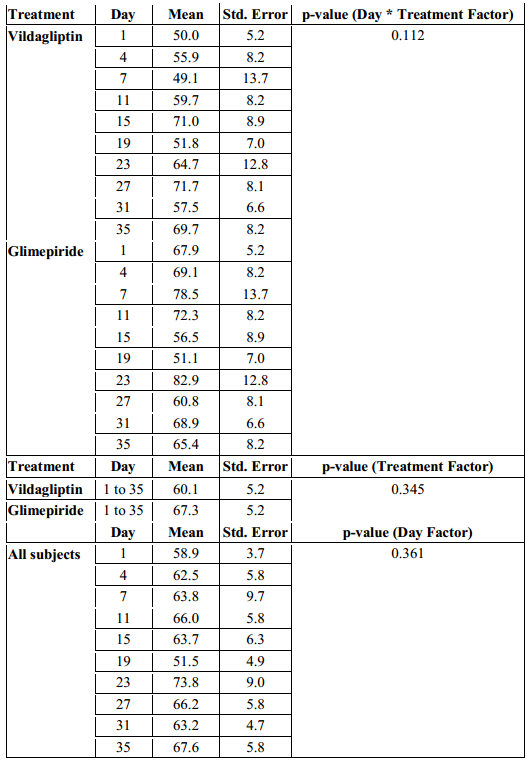
The MAGE in the Vildagliptin group ranged from 50 to 71.7 mg/dl while the glimepiride arm had a MAGE that ranged from 51.1 to 82.9 mg/dl. But even though patients in the glimepiride arm had a higher MAGE, a difference of 11.2 mg/dl above the Vildagliptin arm, their MAGE were not statistically significant when analyzed with regards to time of observation and treatment effect (p-value > 0.112, Table 5).
When the overall MAGE of the subjects in the Vildagliptin arm from day 1 to 35 was compared with the MAGE of the subjects in the Glimepiride arm, it was also not found to be significantly different. (p-value > 0.345, Table 5).
Differences among MAGE across days in each treatment arm were likewise not found to be significant (p-value > 0.361, Table 5).
Table 5. Mean Amplitude of Glycemic Excursions (MAGE) across Treatments and Days
Although this study did not reach statistical significance, it was shown that even if vildagliptin and glimepiride can both improve glycemia of patients with uncontrolled blood sugar on monotherapy with metformin, as seen by both having downward glucose profiles of both study arms from the start of the study towards week 5 and with comparable levels of glucose at the end of the study, vildagliptin had a less abrupt glucose lowering effect as compared to glimepiride, suggesting lesser risk of hypoglycemia.
On the other hand, both arms had a comparable effect on postprandial glucose (AUCpp). The effect of vildagliptin on postprandial glucose excursions which can be attributed to its incretin effect on beta and alpha cells was not seen to be superior to sulfonylurea in this study based on the AUCpp. However, a slight difference was seen in the MAGE of each treatment arm which may suggest otherwise. Vildagliptin resulted to lower MAGE in subjects as compared to glimepiride, hence, superiority of vildagliptin on its effect in the improvement in both β-cell function and α-cell function9 may not be disregarded.
However, comparison of the two treatments may not be fully established in this study as statistical power was not reached in most of the analysis due to the inadequate sample size.
REFERENCES:
1. Ahren, B., Foley, J., et al. Changes in Prandial Glucagon Levels After a 2-Year Treatment With Vildagliptin or Glimepiride in Patients With Type 2 Diabetes Inadequately Controlled With Metformin Monotherapy. Diabetes Care. 2010. 33:730–732.
2. Balas B., Baig, M., et al. The dipeptidylpeptidase IV inhibitor vildagliptin suppresses endogenous glucose production and enhances islet function after single-dose administration in type 2 diabetic patients. J Clin Endocrinol Metab. 2007;92: 1249–1255.
3. Monier, L., Mas, E., et al. Activation of Oxidative Stress by Acute Glucose Fluctuations Compared With Sustained Chronic Hyperglycemia in Patients With Type 2 Diabetes. JAMA. 2006;295:1681-1687.
4. Ceriello A, Esposito K, Picone L, et al. Oscillating glucose is more deletetious to endothelial function and oxidative stress than mean glucose in normal and type 2 diabetic patients. Diabetes. 2008; 57:1349-1354.
5. Monnier L, Mas E, Ginet C, et al. Activation of oxidative stress by acute glucose fluctuations compared with sustained chronic hyperglycemia in patients with type 2 diabetes. JAMA. 2006; 295(14):1682-1687.
6. Hirsh IRL. Glycemic variability: It’s not just about A1c anymore! Diabetes Technology and Therapeutics. 2005; 7(5):780-783.
7. Service FJ, Molnar GD, et al. Mean amplitude of glycemic excursions, a measure of diabetic instability. Diabetes. 1970. 19(9): 644-655.
8. Rizzo, MR, Marfella,R, et al. Relationships between daily acute glucose fluctuations and cognitive performance among aged type 2 diabetic patients. Diabetes Care. 2010. 33:2169-2174.
9. Rosenstock, J, et al. Effects of the Dipeptidyl Peptidase-IV Inhibitor Vildagliptin on Incretin Hormones, Islet Function, and Postprandial Glycemia in Subjects With Impaired Glucose Tolerance. Diabetes Care. 2008. 31:30–35.


 (3 votes, average: 3.67 out of 5)